Quick Summary
- Lake Tahoe clarity declines nearly 5 feet in 2015 over previous year, to 73.1 feet
- Warmer water and lack of snow in 2015 contributed to decline
- Decline not part of a long-term trend. Average clarity has hovered around 71 feet for past 15 years
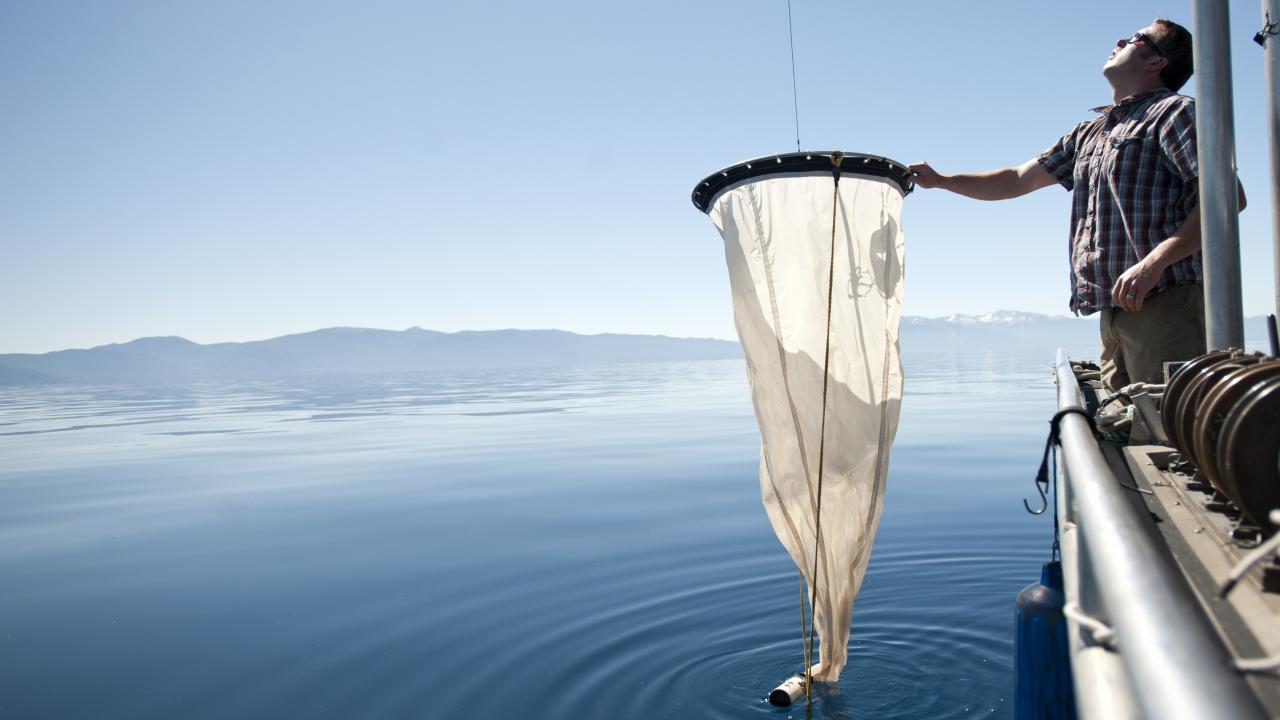
Clarity levels at Lake Tahoe in 2015 declined in both summer and winter, due in part to warmer waters, according to researchers at the University of California, Davis, who have studied the lake for the last half-century.
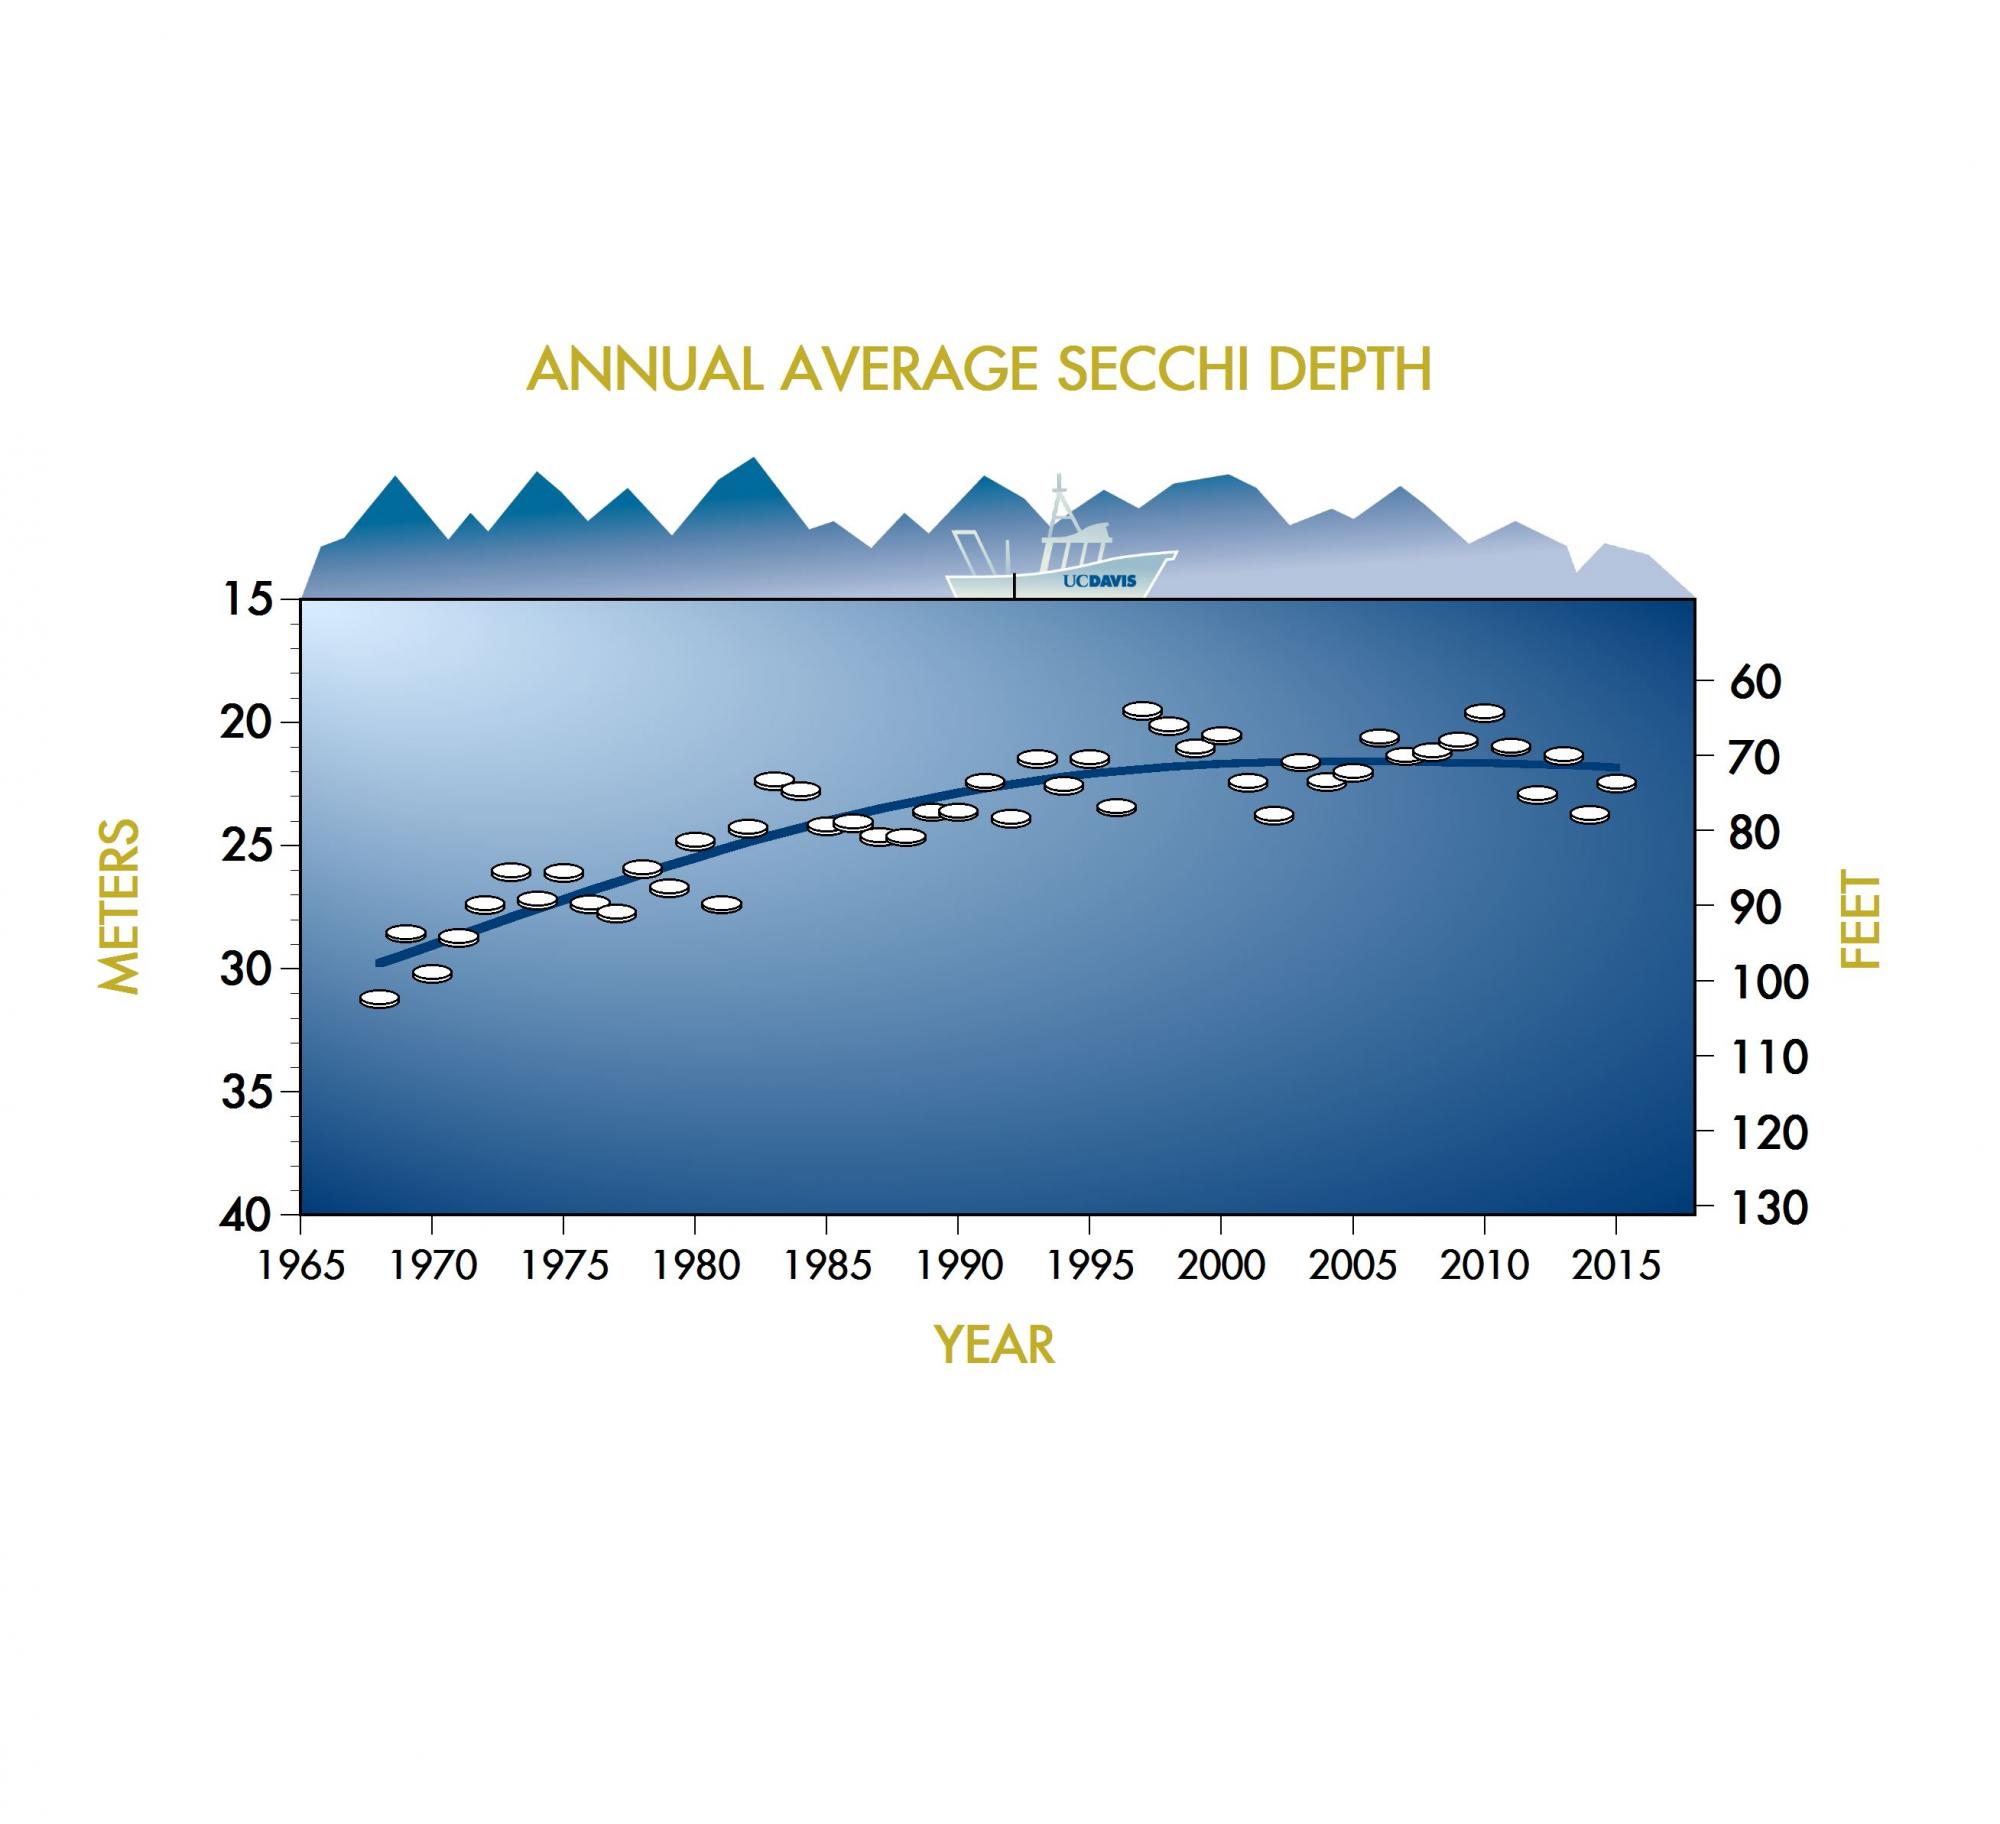
Data released today by the UC Davis Tahoe Environmental Research Center and the Tahoe Regional Planning Agency reported the average annual clarity level for 2015 at 73.1 feet. That is the depth at which a 10-inch white disk, called a Secchi disk, remains visible when lowered into the water.
This is a 4.8 foot decrease from the previous year but is still over 9 feet greater than the lowest recorded average of 64.1 feet in 1997.
The declines are not considered to be part of a long-term trend. They are part of the year-to-year variability that has always characterized conditions at the lake. The record indicates that Lake Tahoe’s long-term trend of decline ended about 15 years ago. Since then, clarity has hovered around a value of 71 feet.
Warmer runoff water affects lake
“It is commonly believed that drought years produce clearer water conditions, but the reality is more complicated than that,” said Geoffrey Schladow, director of the UC Davis Tahoe Environmental Research Center.
The annual precipitation for 2015 was 18 inches, only slightly lower than the previous year. However, the fraction of precipitation that fell as snow was only 5.3 percent, the lowest recorded measurement in 105 years.
“In 2015, the runoff water into the lake was warmer than the previous year, on account of the low snow-to-rain ratio,” Schladow said. “As a consequence, fine particles flowed in closer to the surface, where they impacted clarity, rather than plunging to the deeper parts of the lake.”
Seasonal variability
The 2015 clarity level is the average of 30 individual readings taken from January through December 2015. The highest value recorded in 2015 was 86.5 feet on April 22, and the lowest was 59.9 feet on Feb. 3.
Winter clarity last year declined by 7.6 feet. The winter average of 71.6 feet was above the worst winter average, 66.6 feet, seen in 1997.
During most years, summer clarity is poorer than winter clarity, but 2015 was an exception. Summer clarity averaged 73 feet, a 3.7 foot decline over the preceding year. The lack of deep mixing during the winter resulted in very little of the pristine, deep water being brought up to the lake surface to dilute the clarity-reducing contaminants. Despite this, the long-term decline in summer conditions is still a major concern.
Working together
The Tahoe Regional Planning Agency leads the collaborative effort to reduce stormwater runoff and manages the multijurisdictional Lake Tahoe Environmental Improvement Program to repair past damage to the ecosystem.
Over the past two decades, the Environmental Improvement Program has resulted in substantial public and private investment in projects to improve water quality and other environmental indicators at Lake Tahoe. Among the hundreds of measurements the TRPA tracks, mid-lake clarity is a key indicator of whether restoration programs are working.
“We are pleased to see that our extensive work to reduce stormwater pollution into Lake Tahoe has contributed to stopping the long-term decline in its water clarity,” said Joanne S. Marchetta, executive director of Tahoe Regional Planning Agency. “TRPA will continue to work with scientific researchers and other agencies to better understand the dynamics of lake mixing and climate influences, and work toward the best solutions to restore Tahoe’s famed clarity.”
Clarity a key indicator for Tahoe
Water clarity measurements have been taken continuously since 1968, when the Secchi disk could be seen down to 102.4 feet, and is one of the longest, unbroken clarity records in the world. Secchi depth is the most widely used method of clarity measurement, and the values agree with laser-based measurements also taken by TERC researchers.
Improved real-time monitoring instruments, together with sophisticated models of the lake currents that transport contaminants in Lake Tahoe, are helping researchers build a deeper understanding of restoration progress within the entire lake ecosystem.
“The Secchi depth is but one indicator of Lake Tahoe’s ecological health, albeit a very good one,” Schladow said. “The extreme conditions in 2015 are also impacting other parts of the system such as the nearshore zone. Separating out what is a long-term change from the expected year-to-year variability for all aspects of the lake is a major challenge for researchers.”
While the average annual clarity in the past decade has been better than in preceding decades, it is still short of the clarity restoration target of 97.4 feet set by federal and state regulators, a goal agencies and the Tahoe Basin community continue to work toward.
More information about environmental factors affecting Lake Tahoe will be included in the 2015 State of the Lake Report, expected this summer.
Funding for TERC’s clarity analyses comes from the Tahoe Regional Planning Agency and UC Davis.
Media Resources
Tom Lotshaw, Tahoe Regional Planning Agency, 775-589-5278, tlotshaw@trpa.org
Kat Kerlin, UC Davis News and Media Relations, 530-750-9195, kekerlin@ucdavis.edu