Regional tracking of COVID-19 cases aids day-to-day decision making in the UC Davis School of Veterinary Medicine
Written by Pranav Pandit, postdoctoral research fellow at One Health Institute, UC Davis. This blog appeared in full in the One Health Blog.
Building a tool to understand COVID-19 at a regional level
The COVID-19 pandemic has highlighted the importance of constant and real-time disease surveillance to better control unprecedented local outbreaks. Early on in the pandemic, the state of California came up with its own distinct phases for opening the economy and community activities. These phases were based on county-wide thresholds of daily COVID-19 incidence, test positivity, and availability of ICU beds in the county. While county-wide data is continuously available, a composite picture of a group of counties is not as easy to understand. Such information is especially useful for bigger organizations that serve regional communities, such as universities, corporate companies, or dense urban regions that are highly connected.
At the UC Davis School of Veterinary Medicine, faculty, staff, and students come from many parts of California, but primarily from three counties — Yolo, Solano and Sacramento. University students, staff, and faculty commute from these nearby communities, so it's key not to just follow up on the COVID-19 statistics in Yolo County but rather look at a combination of the three counties to make informed decisions on reopening policies. Similarly, larger metropolitan areas, such as the San Francisco Bay Area, can benefit greatly from composite COVID-19 statistics for the region.
My team in the Epicenter for Disease Dynamics within the school’s One Health Institute was tasked with developing a tool that would go beyond county data and help us understand regional risk. Drawing from statistics already provided by the California Department of Public Health, John Hopkins University and CovidActNow.org, we have created a COVID-19 tool that lets the university better understand our regional data and plan our day-to-day decisions.
Creating the tool in Streamlit
Using an interactive tool that enables users to select counties of interest and get composite COVID-19 intelligence for the combined region. You can check out the tool here.
Compiling and presenting the data
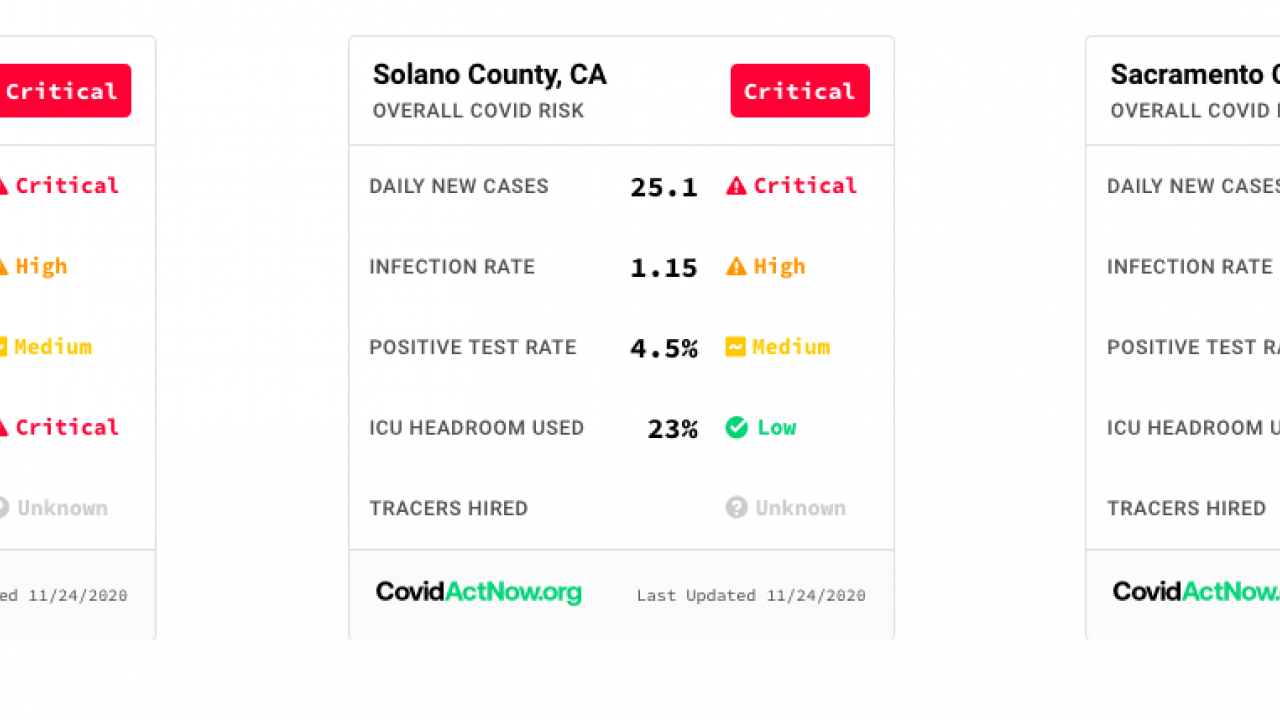
We already had a lot of code developed to track and visualize cases in California with live data provided through the state's data portal. We also started capturing daily case data from the Center for Systems Science and Engineering (CSSE) at Johns Hopkins University and decided to highlight informational snippets related to positive test rates and ICU rooms which is available through CovidActNow.org.
The application starts with displaying a dashboard that shows composite data of three counties surrounding the University of California, Davis (Yolo, Sacramento and Solano). Users can either choose a single county or a combination of multiple counties of their choice to get trends on A) daily new cases per 100,000 population (averaged over the last seven days); B) daily incidence (new cases); ) Cumulative cases and deaths and D) Daily new tests (testing data is available only for a few counties in California).
The initial reopening of a community is indicated when daily cases decline for 21 consecutive days and estimates for new cases per 100,000 are below 25 cases per day (Phase 2). Similarly, Phase 3 economic recovery opening is indicated when estimates for new cases per 100,000 are below 10 cases per day.
Sharing our app with the rest of the world
Once the initial version of the app was ready, I wanted my teammates at UC Davis to access the app, but I didn't want to put them through the ordeal of downloading the source code, setting up the development environment, and running the app locally. Eventually, I was able to deploy the app in just a couple of clicks. All I had to do was host the app source code in a public Github repository.
After the app was deployed to the Streamlit sharing platform, the URL was posted to the school's internal portal and became a tool used in planning field operations while minimizing the risk of exposing students and researchers to COVID-19.
Improving app performance
After working out a few kinks, and as the app was becoming more popular within UC Davis users.
At the UC Davis School of Veterinary Medicine, the tool is now being used to track metrics to better inform campus safety services and communications, but we believe the tool can be used for a wider audience as well.
At this stage of the pandemic, many individuals, families, and smaller organizations are debating their own decisions — whether to take a vacation, if they can visit family during holidays, when to make a work trip, or if it's too much of a risk to conduct daily activities such as grocery shopping. Such activities often require an additional aspect of regional risk assessment, and we hope that our tool can help provide that context.
Please check out the dashboard here, send feedback, and continue to share your own data and create your own great tools. We'll all get through this together.